Lifecycle: Maturing
Provides a base plot theme for ggplot2 to match the xaringan
slide theme created by xaringanthemer. The theme is designed to create a
general plot style from two colors, a background_color and a text_color
(or foreground color). Also accepts an accent_color and an
accent_secondary_color that are xaringanthemer is not required for the
base theme. Use theme_xaringan() or theme_xaringan_inverse() in xaringan
slides styled by xaringanthemer for a plot theme that matches the slide
style. See vignette("ggplot2-themes") for more information and examples.
theme_xaringan_base(
  text_color,
  background_color,
  ...,
  set_ggplot_defaults = TRUE,
  accent_color = NULL,
  accent_secondary_color = NULL,
  text_font = NULL,
  text_font_use_google = NULL,
  text_font_size = NULL,
  title_font = NULL,
  title_font_use_google = NULL,
  title_font_size = NULL,
  use_showtext = TRUE
)
Arguments
| text_color | Color for text and foreground |
|---|---|
| background_color | Color for background |
| ... | Ignored |
| set_ggplot_defaults | Should defaults be set for ggplot2 geoms?
Defaults to TRUE. To restore ggplot's defaults, or the previously set geom
defaults, see |
| accent_color | Color for titles and accents, inherits from
|
| accent_secondary_color | Color for secondary accents, inherits from
|
| text_font | Font to use for text elements, passed to
|
| text_font_use_google | Is |
| text_font_size | Base text font size, inherits from |
| title_font | Font to use for title elements, passed to
|
| title_font_use_google | Is |
| title_font_size | Base text font size, inherits from |
| use_showtext | If |
Value
A ggplot2 theme
See also
Other xaringanthemer ggplot2 themes:
theme_xaringan_inverse(),
theme_xaringan_set_defaults(),
theme_xaringan()
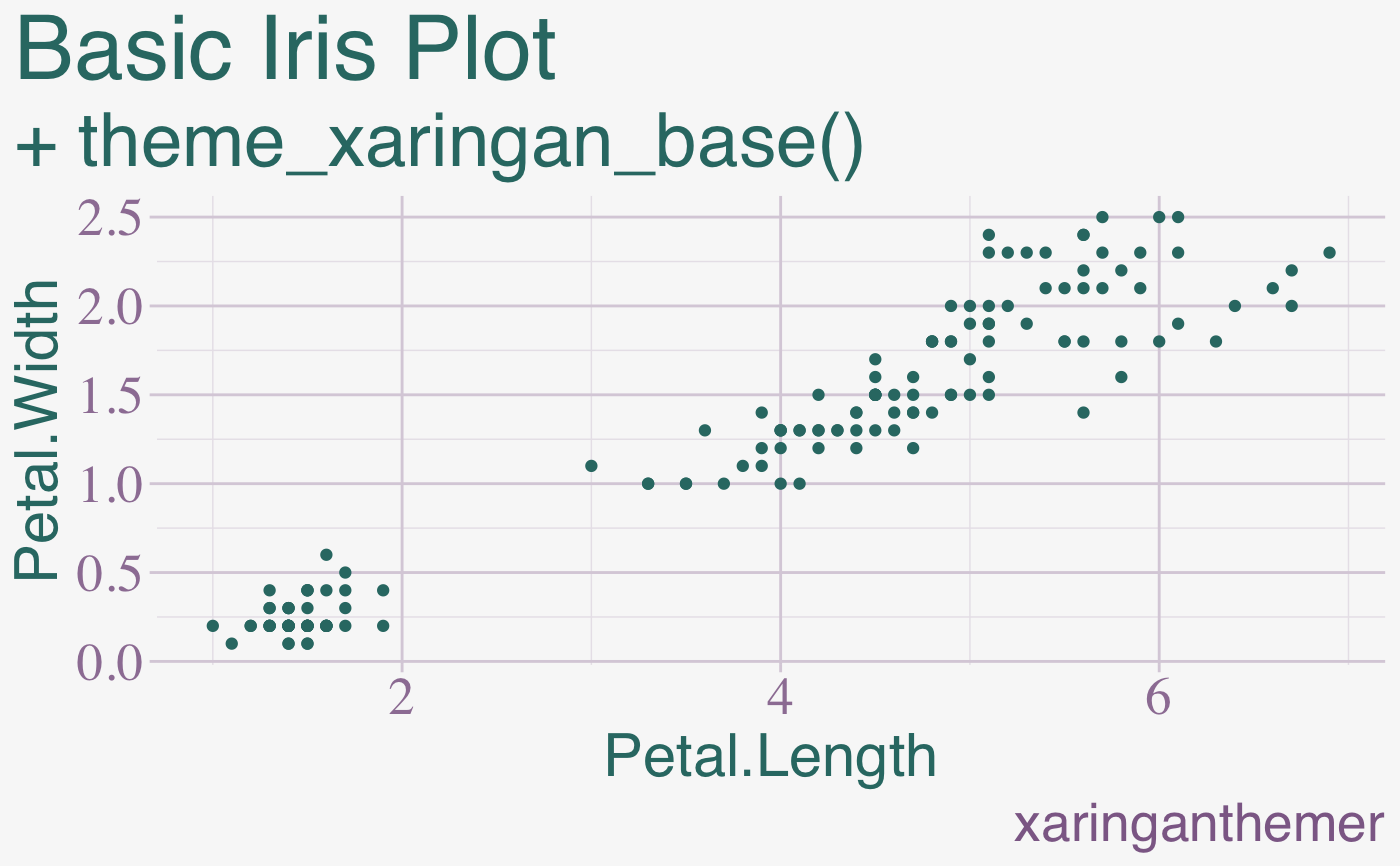
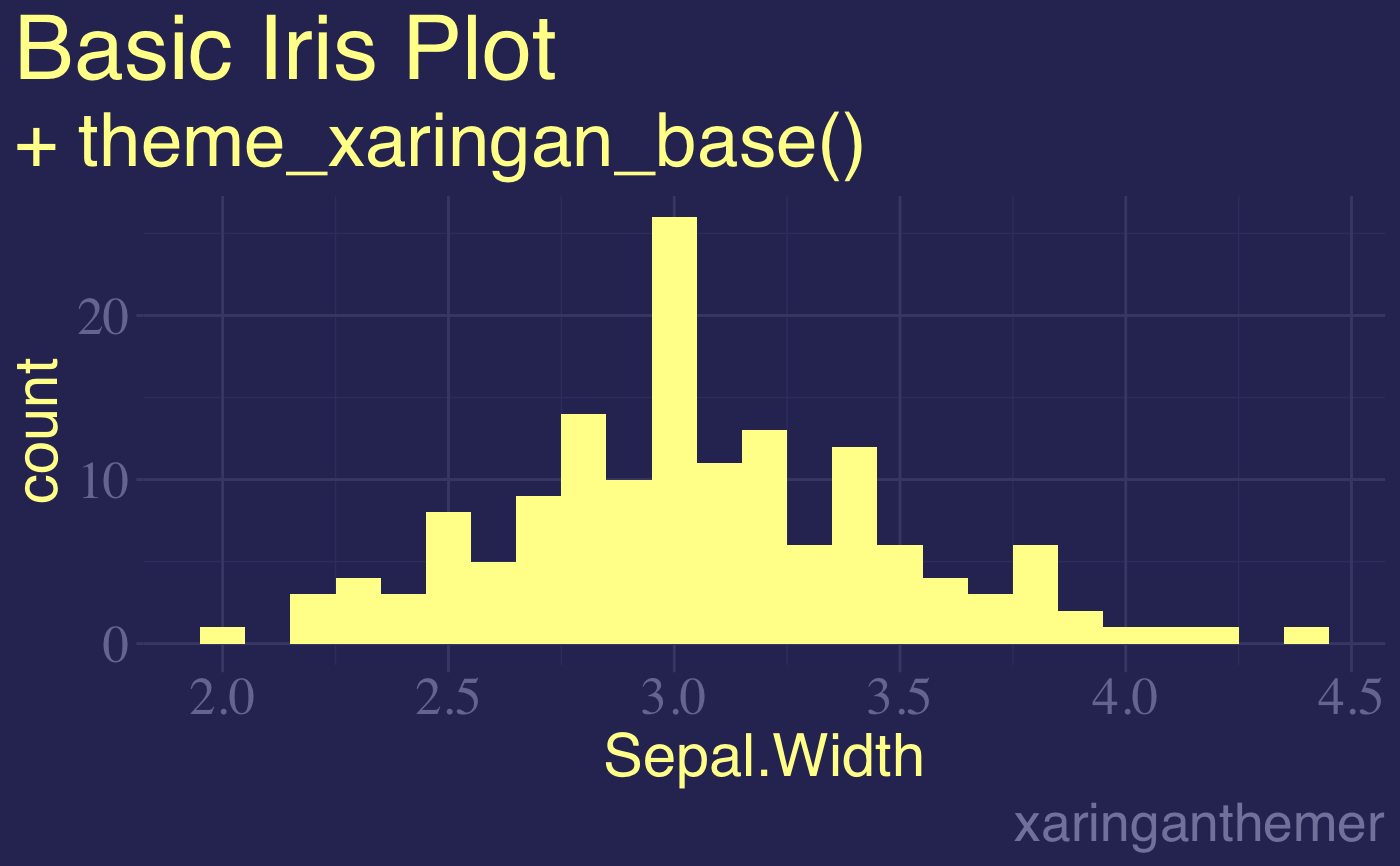
Examples
# Requires ggplot2
has_ggplot2 <- requireNamespace("ggplot2", quietly = TRUE)

if (has_ggplot2) {
  library(ggplot2)

  plot1 <- ggplot(iris) +
    aes(Petal.Length, Petal.Width) +
    geom_point() +
    theme_xaringan_base(
      text_color = "#602f6b",       # imperial
      background_color = "#f8f8f8", # light gray
      accent_color = "#317873",     # myrtle green
      title_font = "sans",
      text_font = "serif",
      set_ggplot_defaults = TRUE
    ) +
    labs(
      title = "Basic Iris Plot",
      subtitle = "+ theme_xaringan_base()",
      caption = "xaringanthemer"
    )

  print(plot1)

  plot2 <- ggplot(iris) +
    aes(Sepal.Width) +
    geom_histogram(binwidth = 0.1) +
    theme_xaringan_base(
      text_color = "#a8a9c8",       # light purple
      background_color = "#303163", # deep slate purple
      accent_color = "#ffff99",     # canary yellow
      title_font = "sans",
      text_font = "serif",
      set_ggplot_defaults = TRUE
    ) +
    labs(
      title = "Basic Iris Plot",
      subtitle = "+ theme_xaringan_base()",
      caption = "xaringanthemer"
    )

  print(plot2)
}